Management GUIs
You shouldn't have to memorize a hundred command-line flags just to see what your server is doing.
One of Terrarium's best features is that it comes with a suite of beautiful, browser-based management dashboards right out of the box. Whether you're checking server health, launching new containers, or troubleshooting network traffic, there is a visual interface ready to help.
By default, these dashboards are located at:
- Cockpit (Host Management):
manage.<your-domain> - LXD (Container Management):
lxd.<your-domain> - Traefik (Network Routing):
proxy.<your-domain>
Note: All of these dashboards are secured behind Terrarium's Single Sign-On (SSO) gate. Only users in your admin group can access them.
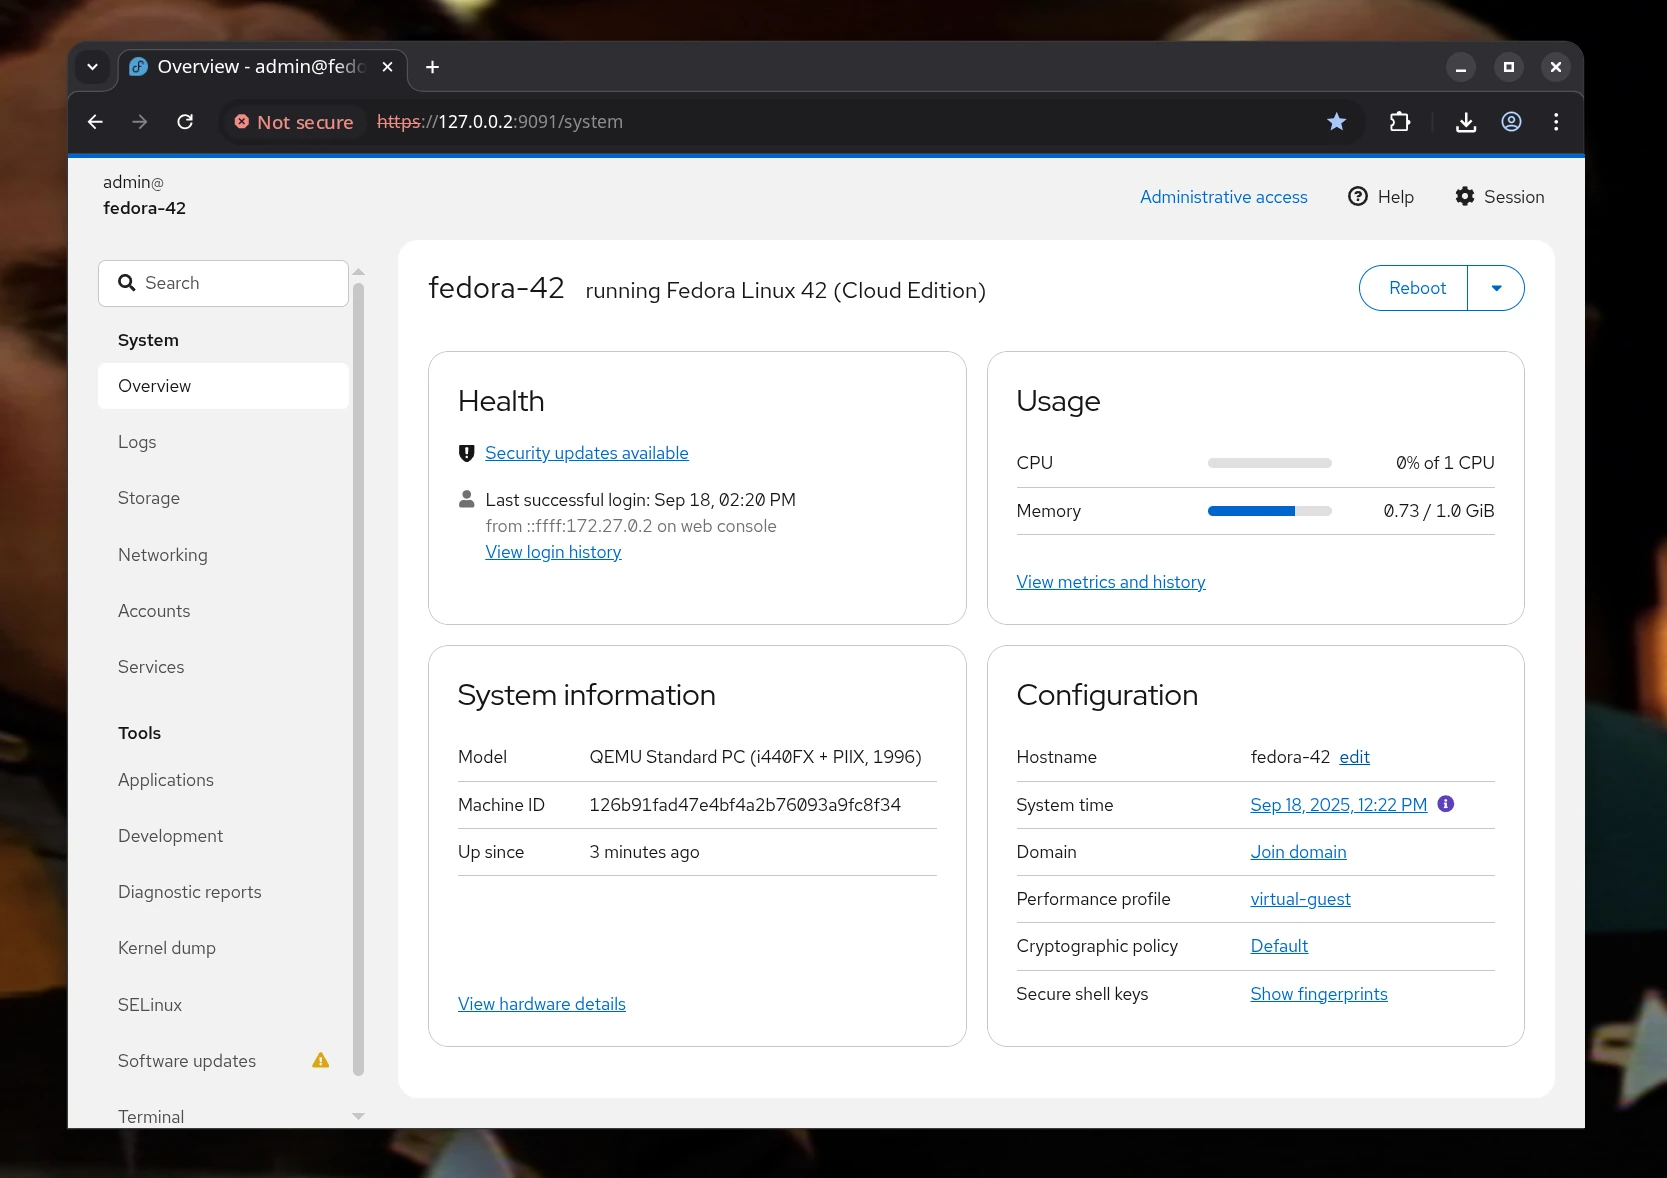
Cockpit (Host Management)
Your server's mission control.
Cockpit gives you a high-level view of your entire server. It's the perfect place to start when you want to:
- Check CPU, memory, and network usage.
- Read system logs without typing
journalctl. - Open a web-based terminal directly to the host.
- Manage firewall rules.
Terrarium also pre-installs special ZFS and S3 extensions for Cockpit, making it incredibly easy to visually manage your time-machine storage pools and backups without needing to be a ZFS expert.
Source: Cockpit project homepage
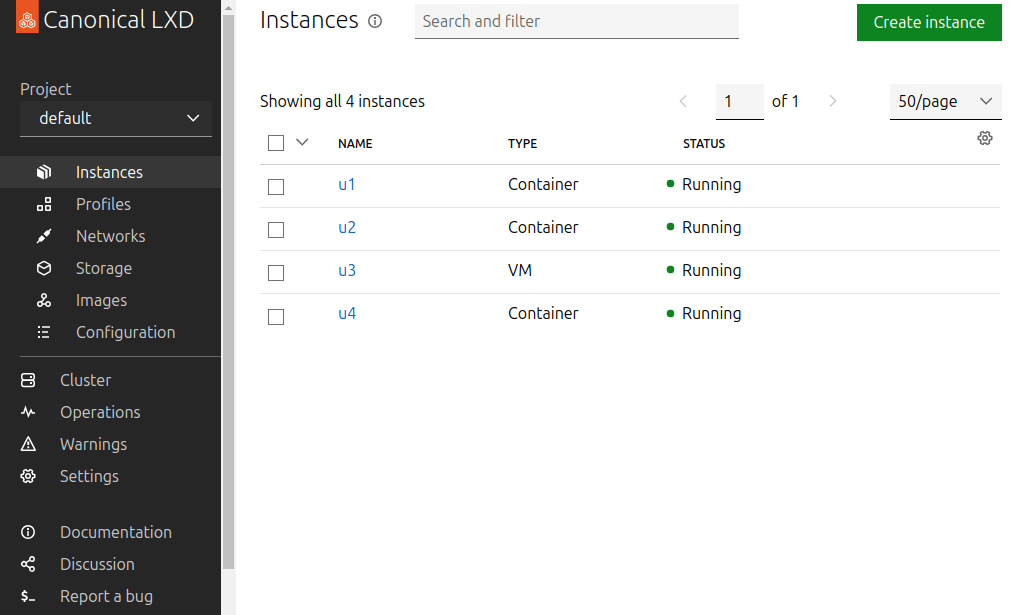
The LXD UI (Container Management)
Where your environments live.
This is likely where you'll spend most of your time. The LXD UI is a sleek dashboard for managing all your isolated workloads. Use it to:
- Create, start, stop, and delete containers.
- View real-time resource usage for specific apps.
- Take and restore snapshots with the click of a button.
- Manage container profiles, networks, and storage.
Source: Canonical MicroCloud tutorial
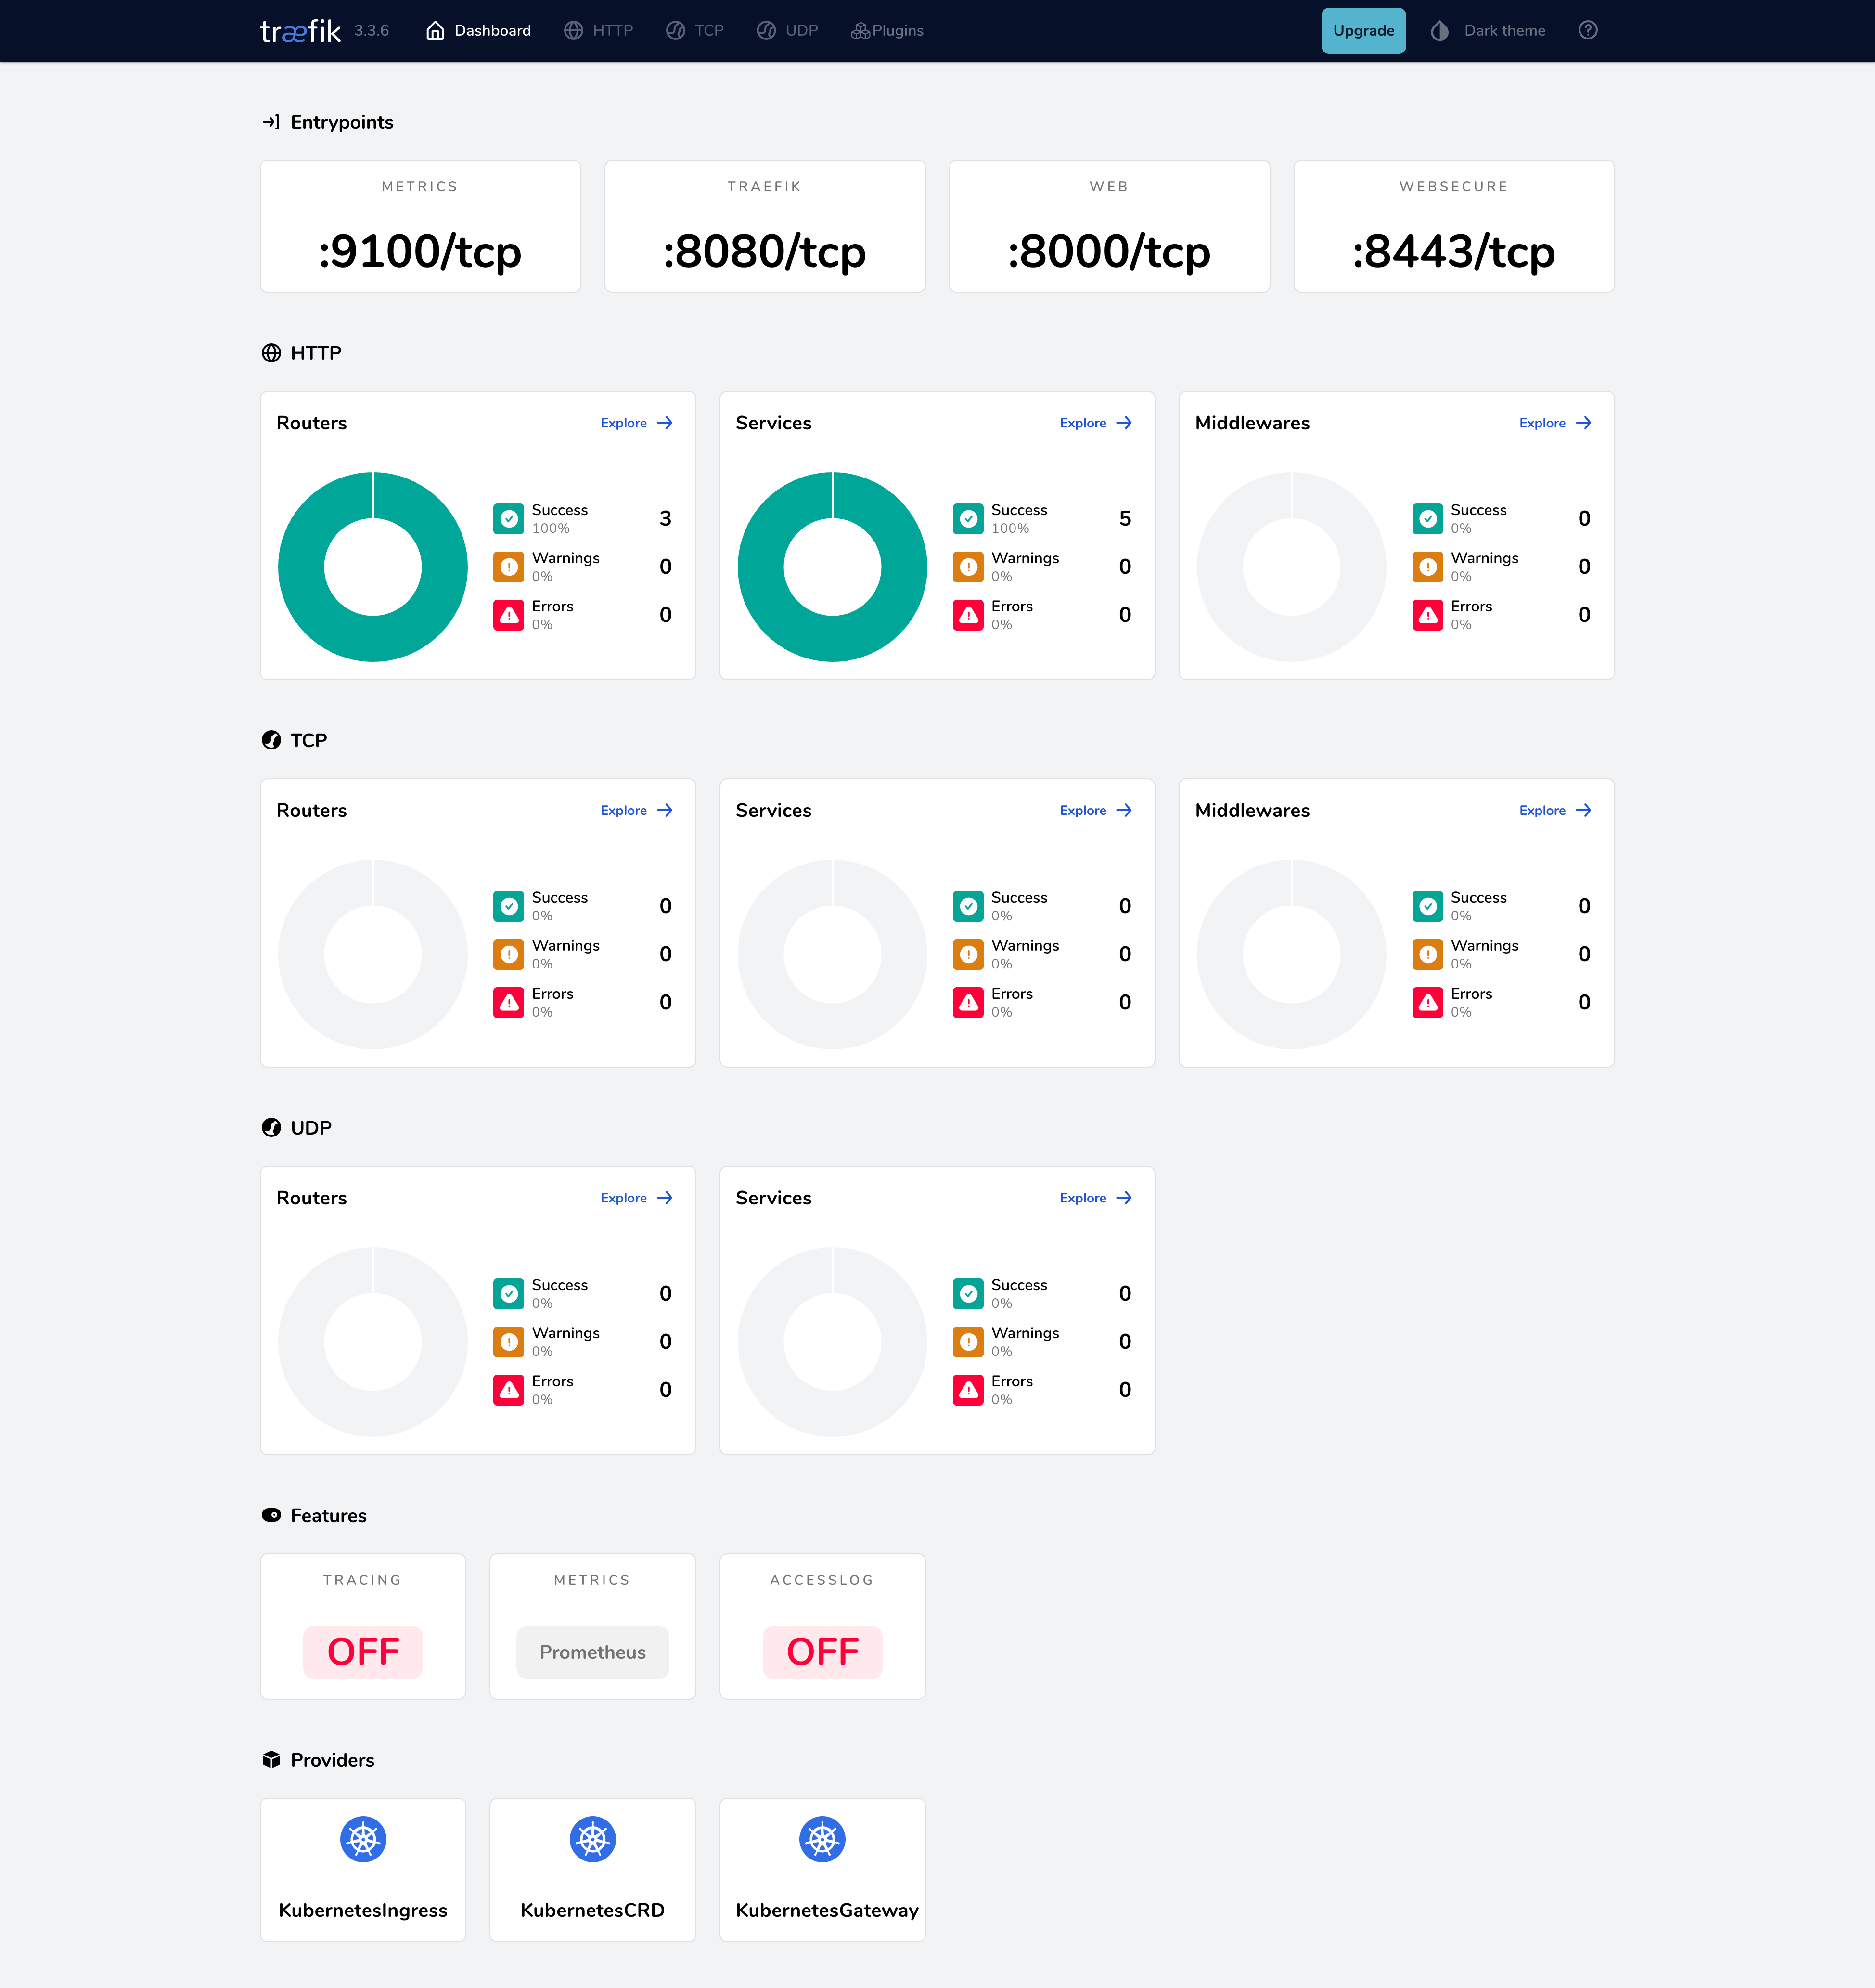
Traefik Dashboard (Network Routing)
The traffic cop.
When you publish an app to the web (like myapp.your-domain.com), Traefik is the engine that routes the traffic to the correct container and handles the SSL certificate.
The Traefik dashboard is invaluable when you need to:
- Verify that a new domain was routed correctly.
- See which apps are currently exposed to the internet.
- Debug routing issues or check which SSO middlewares are active on a route.
Source: Traefik getting started guide
Summary: Which UI should I use?
- Use Cockpit when you want to look at the physical server, manage ZFS storage, or read system logs.
- Use the LXD UI when you want to spin up a new app, restart a container, or restore a snapshot.
- Use Traefik when you want to confirm that a web address is properly pointing to your container.
(And don't worry—if you're a terminal veteran, everything you see in these GUIs can still be done from the command line using terrariumctl and lxc.)